

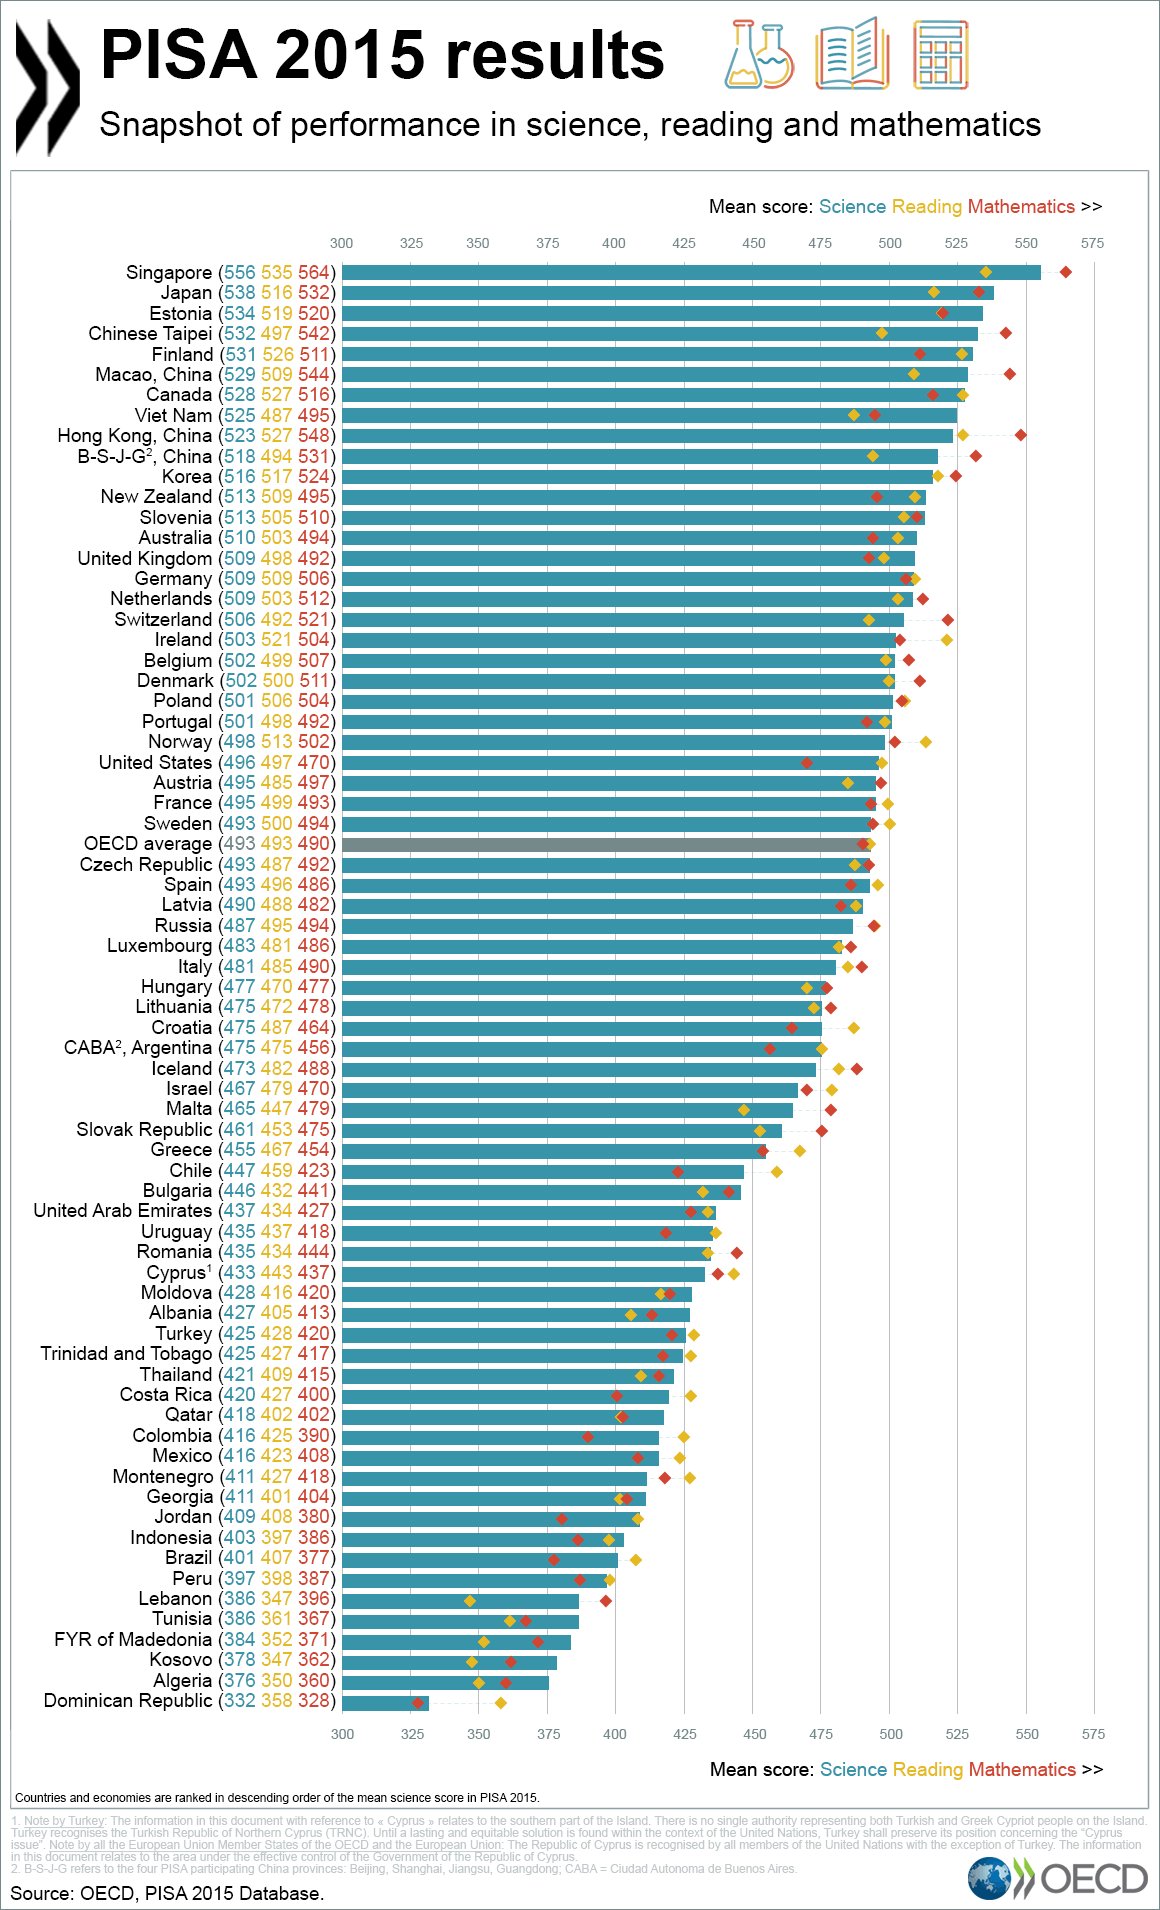
This table is sorted in order of scores on Science, the subject most emphasized in this 3 year period.
Here’s the big PDF of data.
Argentina for the win!
In the past, the Argentines always complained that they were doing a better job of rounding up their dimmest 15 year olds to take the international PISA exam sponsored by the OECD than some countries they could mention, cough Mexico cough, which was dragging their scores down relative to other countries, cough Vietnam cough. I don’t know what the Argentines did to better manipulate their sample this time, but it definitely worked.
Here’s a graph of the Science results (this was the year PISA emphasizes Science), with a column of what percentage of the expected 15 year olds weren’t tested:

The US missed 16% of its expected coverage, which is kind of lousy. Not as bad as Vietnam (51% missing), Mexico (38%), or China (36%), but still …
Here are my posts about older PISA tests, such as 2012 and 2009.
India doesn’t take the PISA test. It tried it out on a couple of states a number of years ago and did very badly.
China is rolling the PISA out to more provinces. It did pretty well this time, but not as well as last time when it reported only the Shanghai results and came in first in the world. China’s coverage in those provinces is 3rd World level too (missing 36% of 15-year-olds). So, we’ll see…
In the past, I’ve broken out American scores by race: Asian Americans typically have done about as well as the wealthy Asian countries; white Americans do better than many European countries but not as well as Finland; Latino Americans do better than Latin countries (although Argentina boosted its scores enormously this time for as of yet unexplained reasons); African Americans do better than any African countries and most West Indian countries that bother to take the PISA test (although Trinidad is climbing). The US government usually posts that data buried in documents here.
 v
v
So, in Science, white Americans (531) scored like Finland, black Americans (433) scored about a standard deviation lower like Cyprus, Hispanic Americans (470) scored between Iceland and Israel, Asian Americans (525) scored like Vietnam (although Vietnam’s score is likely inflated by dropping low scorers from having to take the test), and Multiracial Americans (503) score like Ireland.
Similarly, here’s my graph of the 2012 results (averaging the three subjects equally), showing American groups (red) in racial context:
![]()
Note, this colorful graph is for 2012, not for the new 2015 results.
One question I’ve never seen an answer to is how hard different countries try on this low-stakes test and how much does it matter. One past report included a notation that Austria’s score that year was probably artificially low because teachers were striking and may have told students to do badly on the test to stick it to management. Other countries might give rousing pep talks. Who knows?
Here’s Anatoly Karlin’s comments on the PISA results at the Unz Review.


