How Did Your Kid Do On The APs?
07/10/2010
A+
|
a-
Print Friendly and PDF

How did your kid do on the APs?

Scores for the nearly 3 million Advanced Placement test taken by high school students in May are now arriving in the mail. So, in the interests of helping you parents establish your bragging rights, here's the graph of what AP scores equate to in percentile terms. I created last year for a VDARE.com article. It shows how your kid did, but not compared to all the other kids who took the test, who are a self-selected few, but to all the other kids in the country of his or her age (including those who have already dropped out of high school). The brighter the color, the higher the score. This graph starts at the 90th percentile on the left and goes up. An untruncated graph showing the performance of all kids in the country would be ten times as wide.

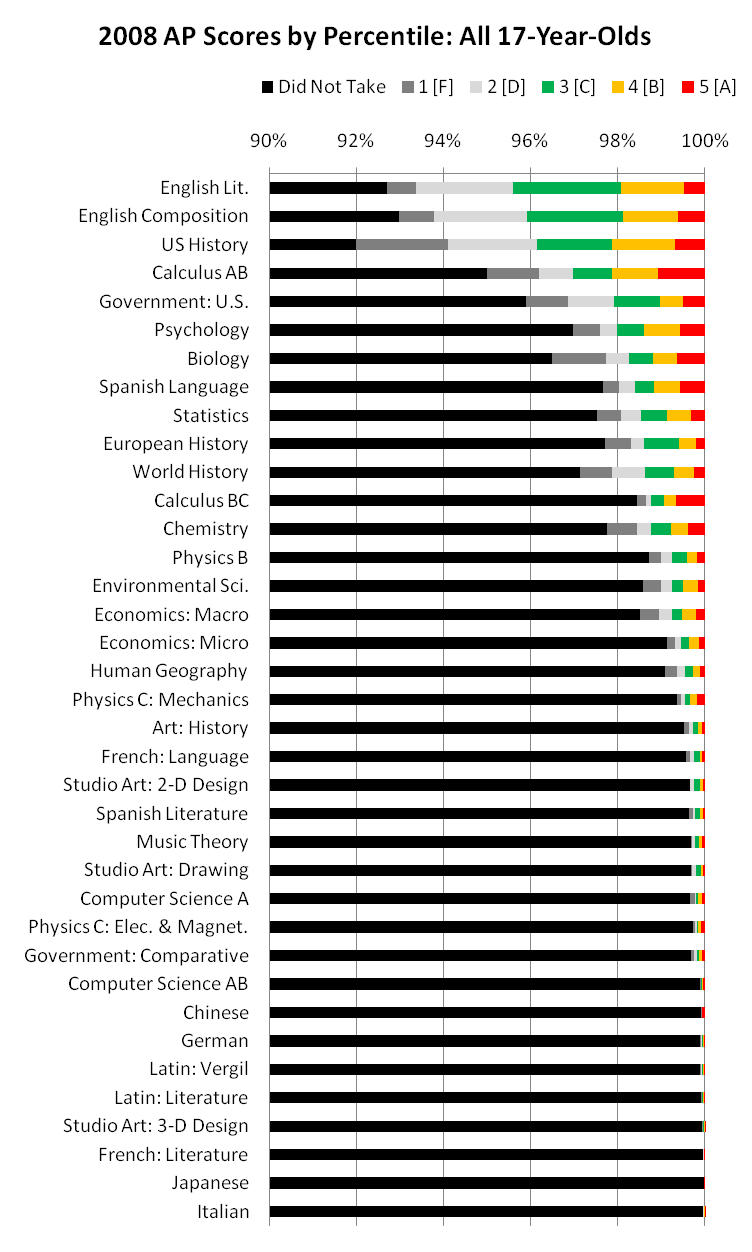
AP tests are graded 1 to 5 with a 5 supposed to be an equivalent to an A in a typical college's introductory year long course in the subject, a 4 equal to a B, and so forth.

So, if your kid took the English Lit test (the top bar in the graph) and got a 4 (the yellow-orange band), he actually scored at the 98th percentile (or higher) out of all kids his age in the country. If he got a 3 (light gray) in US History the third bar down), he scored in at least the 94th percentile.

Of course, if all students took the test, the number of people scoring 3s, 4s and even 5s would go up. In particular, Red State students don't take APs as much as Blue State students, and whites don't take anywhere near as many APs as Asians.

My 2009 VDARE.com article has lots of graphs on how students do on the AP, overall and by race.

Print Friendly and PDF