Note that economists claim to be perplexed that strong job growth has gone on for as long as it has without out triggering strong wage growth. (Wages rose a mediocre 0.3% in April.) The “other” employment survey, of households rather than employers, provides a likely answer: Renewed displacement of native-born American workers by immigrants (legal and illegal) willing to work for less.
In April:
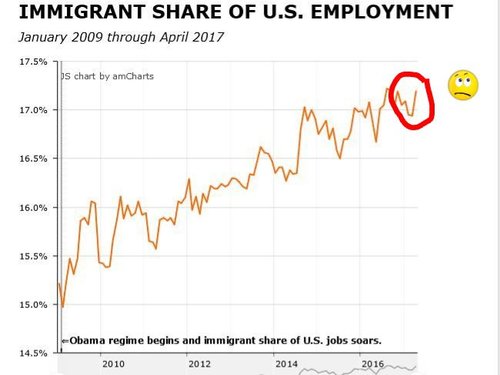
Not since the election has the immigrant share of jobs been at April levels.
Depressingly, we are back to the long-term trend. Native-born American workers lost ground to their foreign-born competitors throughout the Obama years, and this trend accelerated significantly in the months leading up to the election. The displacement of Americans by immigrants, which we measure by the extent by which immigrants have gained jobs at a faster pace than the native-born Americans since January 2009, hit an Obama-Era high in August 2016.
Now that trend is still unbroken, as brought out in our New VDARE.com American Worker Displacement Index (NVDAWDI) graphic:
Native-born American employment growth is represented by the black line, immigrant employment growth is in pink, and NVAWDI—the ratio of immigrant to native-born American job growth—is in yellow.
The index starts at 100.0 in January 2009 for both immigrants and native-born Americans, and tracks their employment growth since then.
From January 2009 through April 2017:
With April’s surge in immigrant employment, Trump’s brief tenure is also marked by an overall increase in native-born American worker displacement. From January through April immigrant employment grew more than twice as rapidly as native-born employment: 1.3% versus 0.6%.
The key variable in the displacement story: the foreign-born share of total U.S. employment. This rose steadily, albeit erratically, throughout the Obama years and, after falling in Trump’s first two full months, roared back to pre-election levels in April.
In February 2009, Barack Obama’s first full month in office, 14.97% of all persons working in the U.S. were foreign-born. In his last full month, December 2016, 17.05% of workers were foreign-born. This implies that Obama-era immigration pushed as many as 3.16 million native-born Americans onto the unemployment rolls.
Last month we estimated the mere threat of a Trump immigration crackdown may have put 168,000 native-born American workers back to work. This was actually quite plausible, given the hysteria about Trump in the MSM. Some immigrants, legal and illegal, may have decided to leave. Others, above all illegals, may have decided not to come after all.
But this month, the immigrant share of employment in April 2017 (17.20%) has rebounded to 0.15% points above the share in Obama’s last month. This implies that Trump’s failure to get a grip on immigration may have put as many as 24,000 native-born Americans out of work.
A detailed snapshot of American worker displacement over the past year is seen in the Employment Status of the Civilian Population by nativity table published in the monthly BLS Report. [PDF]
| Employment Status by Nativity, April 2016-April 2017 (numbers in 1000s; not seasonally adjusted) |
||||
| Apr-16 | Apr-17 | Change | % Change | |
| Foreign born, 16 years and older | ||||
| Civilian population | 40,797 | 41,567 | 770 | 1.89% |
| Civilian labor force | 26,596 | 27,402 | 806 | 3.03% |
| Participation rate (%) | 65.2 | 65.9 | 0.7%pts. | 1.07% |
| Employed | 25,460 | 26,354 | 894 | 3.51% |
| Employment/population % | 62.4 | 63.4 | 1.0%pts. | 1.60% |
| Unemployed | 1,137 | 1,049 | -88 | -7.74% |
| Unemployment rate (%) | 4.3 | 3.8 | -0.5%pts. | -11.63% |
| Not in labor force | 14,200 | 14,165 | -35 | -0.25% |
| Native born, 16 years and older | ||||
| Civilian population | 212,172 | 213,021 | 849 | 0.40% |
| Civilian labor force | 131,891 | 132,415 | 524 | 0.40% |
| Participation rate (%) | 62.2 | 62.2 | 0.0%pts. | 0.00% |
| Employed | 125,615 | 126,908 | 1,293 | 1.03% |
| Employment/population % | 59.2 | 59.6 | 0.4%pts. | 0.68% |
| Unemployed | 6,276 | 5,507 | -769 | -12.25% |
| Unemployment rate (%) | 4.8 | 4.2 | -0.6%pts. | -12.50% |
| Not in labor force | 80,281 | 80,606 | 325 | 0.40% |
| Source: BLS, The Employment Situation-April 2017, Table A-7, May 5, 2017. | ||||
Over the last 12 months (April 2016 to April 2017):
| Change in Foreign-born population from same month prior year (age 16+; in 1,000s; BLS data) |
|
| July 2016 | 1,176 |
| Aug. 2016 | 1,478 |
| Sept. 2016 | 1,471 |
| Oct. 2016 | 1,711 |
| Nov. 2016 | 1,545 |
| Dec. 2016 | 886 |
| Jan. 2017 | 351 |
| Feb. 2017 | 177 |
| Mar. 2017 | 56 |
| Apr. 2017 | 770 |
The immigrant working age population appears to have surged by 770,000 between April 2016 and April 2017. Note that this is still smaller than the 900,000-1 million figure commonly cited as the annual legal influx of all ages. That could mean that the “Trump Effect” is still alive, albeit attenuated, in April. Prior to the election immigrant workforce growth regularly exceeded estimated legal inflow, evidence of the surge of illegal immigration that occurred in Obama’s last year.
(Of course, the foreign-born are only the tip of the immigration iceberg. The true measure of post-1965 immigration impact on the labor market and population would include their U.S.-born children. My estimate: factoring in U.S.-born children virtually doubles immigration’s depression of American wages).
What is happening? Frankly, we are disappointed and surprised by April’s sudden deterioration. The positive trend in American worker displacement and immigrant workforce share had been in place for several months—actually since the election—and was backed by significant anecdotal evidence.
This deterioration could be what statisticians call “noise”—the tendency of data to vary randomly around a major trend. Or it could be that panic among illegals is fading—perhaps because they’ve noted the frustration of Trump’s Executive Orders by rogue federal judges and, of course, the GOP-controlled Congress’ total failure to pass any measure of patriotic immigration reform.
It’s possible the positive trend could resume. But, ultimately, the Trump Administration must act if it is to cut immigration to tighten the labor market and reward its key supporters.
Edwin S. Rubenstein (email him) is President of ESR Research Economic Consultants.